Forrester expects a quarter of planned 2026 AI budgets to slip into 2027, and the reason has less to do with the technology than with how enterprises measure what it produces.
Audio Overview
Video Overview
The numbers tell two stories at once
Enterprises are spending more on AI than ever. KPMG’s Q4 2025 AI Pulse Survey, covering 130 U.S. C-suite leaders at organizations with over $1 billion in revenue, puts the average projected AI spend at $124 million over the coming year. Up from $88 million just two quarters earlier. Two-thirds of these leaders say they would maintain AI spending even through a recession. The money is committed.
The pressure to justify that commitment is intensifying on a separate timeline. Kyndryl’s 2025 Readiness Report, surveying 3,700 senior leaders across 21 countries, found that 61% feel more pressure to demonstrate AI ROI than they did a year ago. The Teneo Vision 2026 CEO and Investor Outlook Survey reveals that 53% of institutional investors anticipate positive returns from AI within six months. Only 16% of large-cap CEOs believe they can actually deliver on that timeline. That 37-point gap between what investors expect and what CEOs think is possible should concern anyone making AI budget decisions right now.

Then comes the correction signal. Forrester’s October 2025 “Predictions 2026” report forecasts that enterprises will defer a quarter of their planned 2026 AI spend to 2027. The money isn’t disappearing from budgets, but it’s being pushed back because the returns aren’t visible yet. Only 15% of AI decision-makers reported an EBITDA lift in the prior 12 months. Fewer than one-third could tie AI value to P&L changes. CFOs are making AI investment decisions for the first time and asking questions that existing metrics can’t answer.
The investment is committed, the pressure to justify it is real, and the returns are not coming in fast enough to meet the expectations of either side. Most observers of this data believe the technology is failing. But I think the problem is more specific: enterprises are measuring the wrong output.
Most organizations track AI performance obsessively, while decision performance is barely tracked at all. That disconnect, more than any system limitation, explains why the ROI story isn’t landing.
What gets reported to the board
Walk into most AI steering committee meetings, and you’ll hear updates on model accuracy, deployment milestones like how many models are in production, copilot adoption rates, and infrastructure costs measured in GPU hours. More recently, the same rooms have added agent-specific reporting, covering how many agents are deployed, their task completion rates, and the cost of each interaction.
These metrics track real things at every layer of the stack, but none of them answer the question the board is asking, which is some version of: “Is AI making us faster, smarter, or more profitable at the things that matter?”
The Cisco AI Readiness Index, which surveyed nearly 8,000 senior business leaders across 30 markets, shows a related mismatch. Only 32% of organizations rate their IT infrastructure as fully AI-ready. Governance readiness scores even lower, at around 24% in Cisco’s most recent edition. The industry’s readiness metrics are infrastructure-focused. They tell you whether the plumbing works. They don’t tell you whether the water is going to a useful destination.
PwC’s 2025 Responsible AI Survey found that nearly 60% of executives say Responsible AI practices boost ROI and efficiency. At the same time, nearly half can’t turn those practices into repeatable processes. The distance between “we believe this works” and “we can prove this works” is where board-level credibility erodes.
There’s a structural reason for this. The metrics that organizations track are mostly those provided by vendors. Vendors sell models and infrastructure, measuring model performance and infrastructure usage. No one in the supply chain has a strong motivation to measure what occurs after the model generates its output. That responsibility lies with the enterprise itself, and most haven’t developed the necessary instrumentation.
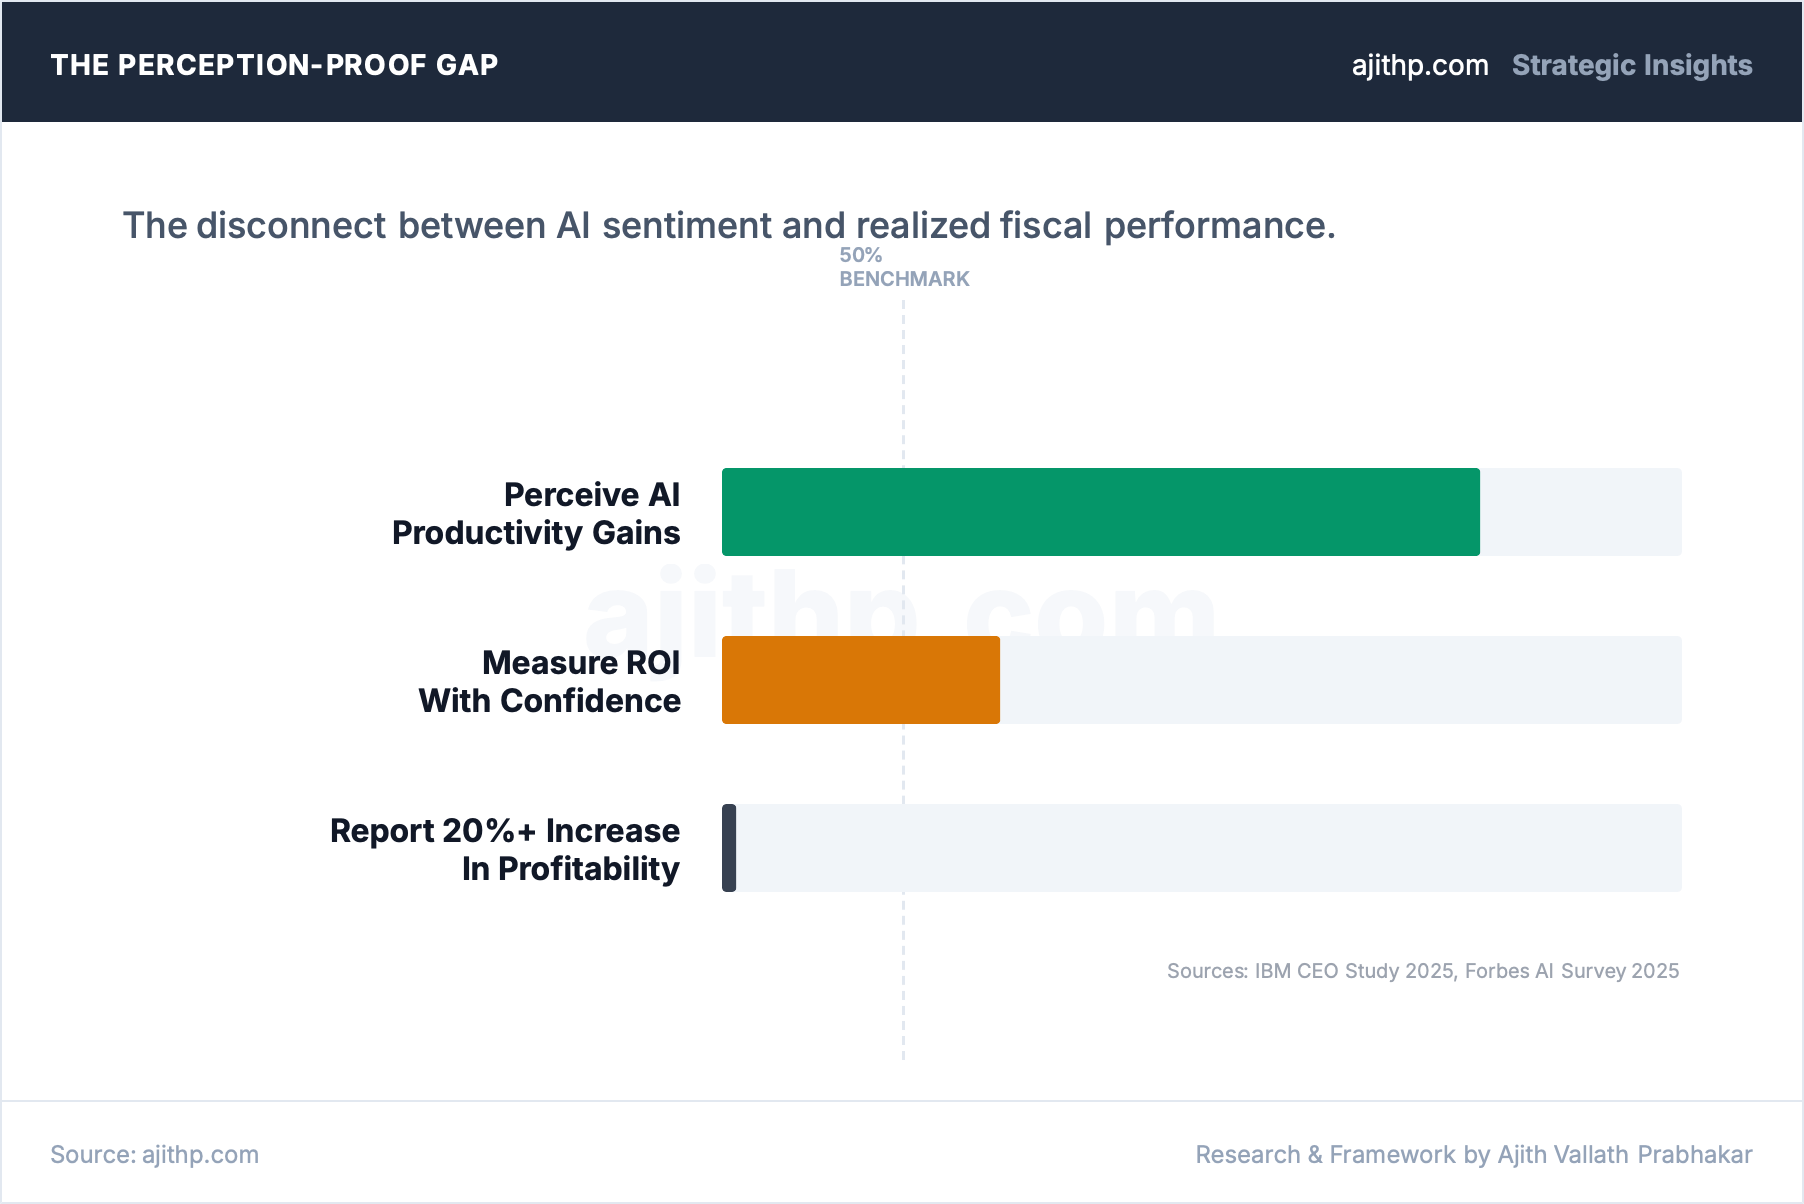
The IBM CEO Study from 2025 put a number on this: 79% of executives perceive productivity gains from AI, but only 29% can actually measure ROI with confidence. Forbes Research’s 2025 AI Survey tells a similar story from the other direction, with fewer than 1% of global executives reporting a 20% or greater profitability increase. And 39% say that measuring ROI and business impact is itself one of their top challenges, which means the measurement problem isn’t sitting alongside the ROI discussion. For nearly four in ten executives, it’s what keeps the ROI conversation from progressing.
Where value disappears
The output of most AI systems is a prediction, but what actually changes a P&L is the organizational decision made after the AI makes that prediction. The distance between those two moments is where most of the ROI gap lives.
Measurement is one of several factors behind this problem, and overstating its role would weaken the argument. McKinsey’s research identifies workflow redesign as the single largest driver of AI EBIT impact. Davenport and Redman argued in Harvard Business Review in early 2025 that underlying business processes “weren’t designed for AI,” meaning perfect decision metrics won’t help if the workflows haven’t been rebuilt around AI capabilities.
Deloitte’s data adds another layer: some of the shortfall is simply a time-horizon problem, with most organizations reporting satisfactory returns emerging over two to four years. And model accuracy is absolutely the right metric for certain use cases. In fully automated, low-latency systems like algorithmic trading or real-time fraud blocking, there is no organizational decision loop to measure. Decision Velocity matters most for complex, multi-stakeholder enterprise decisions where organizational friction, not model performance, is the bottleneck.
Even so, most enterprises aren’t measuring this, and the evidence for that blindspot is hard to dismiss.
A bank’s fraud detection model that scores transactions at 94% accuracy will clear a quarterly review without much scrutiny. The number nobody in that room reports is how long it takes a flagged transaction to actually result in someone doing something about it, how many flags the operations team quietly ignores because they don’t trust the model’s reasoning, and what each of those overrides costs in analyst time, customer friction, and potential loss.
Those override patterns show up with hard numbers in healthcare. A 2024 meta-analysis in the Health Informatics Journal, covering 16 studies, found that physicians override drug-drug interaction alerts 90% of the time. At Brigham and Women’s Hospital, the number was 100% across more than 37,000 renal clinical decision support alerts over two years. These systems detect drug interactions accurately by every model metric that gets reported. The problem is that almost nobody on the clinical side acts on what the system produces.
Sepsis kills roughly 270,000 Americans a year, and early detection is one of the few clinical interventions that reliably changes that outcome. Two widely deployed prediction systems tried to solve it, with very different results. Michigan Medicine externally validated Epic’s sepsis model across nearly 28,000 patients, yielding an AUC of 0.63, well below the 0.76 to 0.83 range reported internally by Epic. At the recommended alert threshold, the model missed 67% of sepsis cases while generating alerts on 18% of all hospitalized patients. Johns Hopkins’ TREWS system, evaluated across five hospitals and 590,000 patients, hit an AUC of 0.97 with clinician adoption holding at 89% throughout the study. Patients whose alerts were confirmed within three hours saw an 18.7% relative reduction in mortality.

The difference between those outcomes had less to do with model architecture than with how each system related to the clinicians using it. TREWS was built to be transparent, to fit into existing workflows, and to earn trust over repeated use, which meant the predictions actually changed clinical behavior rather than adding noise to an already overloaded alert environment.
Measuring the right interval
Deloitte’s State of AI 2026 report, based on 3,235 business and IT leaders across 24 countries, found that 66% report productivity gains from AI. Sounds encouraging until you read further. Only 25% have moved more than 40% of their AI pilots into production. Only 20% are seeing actual revenue growth. The productivity gains are real but modest. They measure activity, a model running, suggestions generated, rather than outcomes: decisions improved, cycle times reduced, errors prevented.

I keep coming back to a question that seems simple, but that very few organizations can answer: what if you measured the interval between “AI produces insight” and “the organization acts on that insight”? That single measurement captures everything model metrics miss, from trust gaps and approval bottlenecks to governance friction and the kind of quiet organizational resistance that never shows up in a dashboard. It captures the actual distance between what the technology can do and what the business gets from it.
Stanford economist Susan Athey, whose research focuses on the economics of AI adoption, wrote in MIT Sloan Management Review: ML services “predict which customers will purchase when called,” but “that’s not the same as predicting the people for whom a call will make a difference.” Most AI measurement infrastructure is built around prediction. Almost nothing in the typical enterprise stack measures whether the prediction actually changed what someone did.
Enterprises that measure only model performance, without also measuring decision quality, override rates, and business outcomes, systematically underinvest in the organizational changes needed to capture AI value. That underinvestment shapes what gets funded, what gets fixed, and what eventually loses its internal sponsors.
Decision Velocity as the missing metric
The evidence points toward a specific measurement: the time between when intelligence becomes available and when the organization acts on it. I introduced Decision Velocity in September 2025, along with the 4D framework (Define, Design, Deploy, Defend) for implementing it. Six months of market data have considerably strengthened the case.
Model inference takes milliseconds. The organizational response typically takes days or weeks, and the bottleneck is never the technology. It’s context assembly, approval chains, trust deficits between teams, and governance processes that weren’t designed to move at the speed the technology now allows.
Four dimensions make Decision Velocity operational, and each one captures something the standard model dashboard misses.
The first is time-to-action for each decision stream: the elapsed time from model output to organizational action, tracked by decision type rather than by model. A fraud detection system and a claims adjudication system have very different velocity profiles, and averaging them buries the signal you need.
The second is override rate, which functions as a direct proxy for organizational trust. A 2025 diagnostics study found override rates of 1.7% for transparent AI predictions and over 73% for opaque ones. When override rates are high, the cause is usually that the decision framing doesn’t match how the people involved actually work, or that the model’s reasoning isn’t visible enough for someone to stake a clinical or financial judgment on it.
The third is governance coverage: what share of AI-informed decisions have clear ownership, an audit trail, and a defined escalation path. Any decision without that coverage is one that the organization can’t defend to a regulator or a courtroom.
The fourth is ROI per decision stream, meaning value created or preserved per decision type rather than “model ROI” averaged across the portfolio. Each stream should be traceable to named business outcomes with attributable value.
In practice, this means a claims adjudication team’s monthly report would show time-to-action by claim type alongside model accuracy, override rates broken out by adjuster seniority, governance coverage for each decision pathway, and revenue impact per claim stream. The model dashboard doesn’t disappear. It becomes one input into a measurement system that’s designed around what the organization actually needs to know.

Most teams assume governance slows AI deployment down, but the Databricks State of AI Agents 2026 report found something different in their platform telemetry across 20,000 customers. Companies using governance tools such as access controls, lineage tracking, and policy enforcement had 12 times as many AI projects reach production as those without, and companies using structured evaluation tools had six times more. Maturity is a confounding factor here, since the organizations adopting governance tools are probably more capable for other reasons too, but even with that caveat, the correlation is hard to ignore.
KPMG’s data points in the same direction, with 75% of enterprises ranking security, compliance, and auditability as the most critical requirements for AI agent deployment. The market has broadly accepted that ungoverned AI doesn’t scale, but most organizations still lack the measurement layer that connects their governance discipline to actual decision speed.
Gartner published its inaugural Magic Quadrant for Decision Intelligence Platforms in January 2026, evaluating 17 vendors and predicting that 75% of Global 500 companies will adopt decision intelligence practices by 2026. By 2028, Gartner expects 25% of Chief Data and Analytics Officer vision statements to replace “data-driven” with “decision-centric.” The Magic Quadrant helps organizations choose platforms for decision modeling and automation, but it doesn’t address what happens after the platform is in place. Decision Velocity picks up where that evaluation ends, measuring whether automated decisions are actually moving through organizational approvals into action or stalling somewhere in the middle.
I wrote up the full 4D methodology in September 2025 for anyone who wants the implementation detail. What’s changed since then is six months of market data from Forrester, KPMG, Gartner, Databricks, and Deloitte, and all of it points the same direction: the organizations measuring decisions are the ones getting past pilot and keeping their funding.
The 2026 timeline
The data supports measuring decisions rather than models. Three things happening simultaneously in 2026 make the window for acting on that shorter than most teams realize.

Investor timelines
The investor timeline has already compressed past what most AI teams are prepared for. Teneo’s survey shows 53% of investors expect ROI in six months. PwC’s 29th Global CEO Survey found that 56% of CEOs haven’t yet realized either revenue or cost benefits from AI. And MIT’s Project NANDA, published July 2025, found that 95% of organizations deploying generative AI saw zero measurable P&L impact within six months. The few that succeeded focused on one valuable problem and built systems that could “adapt, remember, and evolve.” When Kyndryl reports that 61% of leaders feel more pressure to demonstrate ROI than a year ago, this is the context behind that pressure. Boards aren’t going to wait for model accuracy to translate into business results on its own timeline.
Regulatory evidence requirements
The regulatory environment has shifted in parallel. The EU AI Act’s high-risk obligations currently target August 2, 2026, for full applicability, though the European Commission’s Digital Omnibus proposal could delay this. Texas’s Responsible AI Governance Act took effect January 1, 2026. Colorado’s AI Act takes effect June 30, 2026, after a five-month delay. California’s AI Transparency Act went into effect on January 1, 2026. What these regulations share is a focus on consequential decisions made by or with AI systems, and the evidence they require is decision-level audit trails, not model performance summaries. Organizations that instrumented their decision processes early will have what regulators ask for. Most organizations built their reporting around model dashboards, which is not what anyone is coming to inspect.
Agentic scale
Agentic deployments add a third layer of urgency. Gartner predicts 40% of enterprise applications will feature task-specific agents by the end of 2026, up from less than 5% in 2025, and in the same forecast projects that over 40% of those agentic projects will be canceled by the end of 2027 due to escalating costs, unclear value, or inadequate risk controls. If measuring decision quality is hard with a human in the loop, it becomes nearly impossible when 50 autonomous agents are operating across the enterprise simultaneously. The observability vendors are already repositioning around this. Datadog launched AI Agent Monitoring in mid-2025, mapping each agent’s decision path through inputs, tool invocations, and outputs. Arize expanded to agent-level decision visibility. The shift these companies are making, from monitoring infrastructure health to monitoring decision quality, is the same shift this article is arguing enterprises need to make in their own measurement.
Any one of these pressures would be enough to force the question. The fact that all three are hitting within the same 12-month window means that organizations still reporting model metrics to their boards by late 2026 will find themselves unable to answer what investors, regulators, and their own agent infrastructure are simultaneously asking.
Three things to do before the next board meeting
A VP of AI or CIO can do all three of these within 30 days.
Audit your AI reporting. Pull the last three board decks or steering committee updates covering AI initiatives. Count how many metrics reference model performance versus decision outcomes. If the ratio is above 3:1, your reporting explains the technology but not the value. The IBM CEO Study found that only 29% of executives can measure AI ROI confidently, yet 79% perceive productivity gains. That spread between feeling it works and being able to prove it financially is what your board sits with every quarter, and your reporting should be designed to close it.
Pick one decision stream and measure it end-to-end. Don’t try to instrument everything. Choose the highest-value AI-assisted decision process in your organization, whether that’s claims adjudication, credit decisioning, clinical recommendations, or underwriting. Map the full lifecycle from model output to organizational action, measure the elapsed time, and identify where it stalls. That’s your Decision Velocity baseline.
Two insurance examples show what this looks like in practice. Markel Insurance worked with Cytora to compress underwriting quote turnaround from 24 hours to 2 hours, driving a 113% increase in underwriting productivity, measured as gross written premium per employee. Underwriters still made the call, but the time between receiving a submission and reaching a decision dropped from a full day to two hours. MassMutual’s Haven Life saw a similar pattern: when AI accelerated policy issuance, 25% fewer applicants abandoned the process. Both cases are worth noting because the AI didn’t need to be smarter; it needed the decision to happen faster.
Define what “acted on” means for each AI system. For every AI tool in your portfolio, answer one question: what specific organizational action should this system’s output trigger? If you can’t name the action, the system is producing information rather than enabling decisions, and the ROI will reflect that. The better question to ask about any model isn’t “what does it do?” but “what does the organization do differently because it exists?” When the answer is vague, the business case will be too.
One practical note: in the organizations I’ve observed doing this well, ownership of decision measurement sits with whoever owns the business outcome, not with the AI platform team. The platform team provides the instrumentation. The business owner defines what “acted on” means and whether the velocity is acceptable. Without that split, decision metrics become another technical dashboard that nobody outside engineering reads.
The measurement gap as a 12-month problem
S&P Global found that 42% of companies have already abandoned the majority of their AI initiatives before reaching production, up from 17% the prior year. Most of the organizations walking away aren’t doing it because the models failed. They’re doing it because they couldn’t show their stakeholders how AI was changing the way decisions got made, and eventually the internal sponsors stopped advocating for the budget.
The Futurum Group’s 1H 2026 survey of 830 IT decision-makers captured the same shift from a different angle. Productivity, as the leading AI ROI metric, dropped 5.8 percentage points. Direct financial impact nearly doubled. As Keith Kirkpatrick at Futurum observed, the productivity argument worked for the pilot phase, but the market has moved past it.
Organizations that build decision measurement infrastructure now will have what they need for agentic governance within 12 months. Those that don’t will find themselves trying to govern autonomous agents with dashboards that were built for a different purpose, and the S&P data on initiative abandonment suggests how that plays out. The organizations I work with that have started measuring decisions rather than models aren’t doing anything exotic. They’re tracking the four dimensions described above, and the first thing most of them discover is how much organizational friction was invisible before they started looking.
Decision Velocity is the first of three pillars in the CTRS framework. The second, Version Drift Prevention, addresses what happens when AI retrieves technically correct information that has been officially superseded. The third, Agent Orchestration, tackles governance for autonomous agents operating at enterprise scale. All three share the same foundation: you cannot govern what you cannot measure, and what enterprises measure today was designed for a different era of AI.
Related Reading
- Decision Velocity: The New Metric for Enterprise AI Success — The original Decision Velocity article introducing the 4D framework (Define, Design, Deploy, Defend) and the full implementation methodology referenced throughout this piece.
- Enterprise AI Version Drift: The Hidden Risk and How to Fix It — CTRS Pillar II. What happens when AI retrieves technically correct information that has been officially superseded, and the Trust Layer architecture that prevents it.
- The Architecture Gap: Why Enterprise AI Governance Fails — Why 72% of enterprises have AI in production but only 9% have mature governance. The structural reasons governance stays performative, and the architectural patterns that make it operational.
- MCP: The Integration Fabric for Enterprise AI Agents — CTRS Pillar III. How Model Context Protocol solves the N×M integration problem for agent orchestration, and why it matters for governing autonomous agents at scale.
- Multimodal Reasoning AI: Models, Use Cases, and Future Trends — The reasoning architectures that sit upstream of Decision Velocity. How multimodal models fuse inputs through RAG and graph-based adapters before enterprise decision loops begin.
Sources
- 1. KPMG, “AI Quarterly Q4 2025 Pulse Survey,” January 2026. 130 U.S. C-suite leaders, $1B+ revenue organizations, fielded November 7 to December 15, 2025.
- 2. Kyndryl, “2025 Readiness Report,” October 2025. 3,700 senior leaders across 21 countries, conducted by Edelman DXI.
- 3. Teneo, “Vision 2026: CEO and Investor Outlook Survey,” December 2025. 350+ global CEOs and 400+ institutional investors, ~$19T combined market cap and AUM.
- 4. Forrester Research, “Predictions 2026: Artificial Intelligence” (RES184992), October 2025. Analyst prediction.
- 5. Cisco, “AI Readiness Index 2024/2025.” ~8,000 senior business leaders, 30 markets, 26 industries.
- 6. PwC, “2025 US Responsible AI Survey: From Policy to Practice.” 310 U.S. business leaders.
- 7. Deloitte AI Institute, “The State of AI in the Enterprise,” January 2026. 3,235 business and IT leaders, 24 countries.
- 8. Databricks, “2026 State of AI Agents,” January 2026. Platform telemetry, 20,000+ customers. Correlation, not controlled experiment.
- 9. Wong et al., “External Validation of a Widely Implemented Proprietary Sepsis Prediction Model,” JAMA Internal Medicine, 2021.
- 10. Adams et al., “Prospective, multi-site study of patient outcomes after implementation of the TREWS machine learning-based early warning system,” Nature Medicine, 2022.
- 11. Health Informatics Journal, meta-analysis of physician override rates in clinical decision support, 2024. 16 studies.
- 12. Gartner, “Magic Quadrant for Decision Intelligence Platforms,” January 2026. Inaugural edition, 17 vendors.
- 13. Gartner, AI agent enterprise application predictions, August 2025.
- 14. MIT Project NANDA, July 2025.
- 15. PwC, “29th Annual Global CEO Survey,” early 2026.
- 16. IBM, “CEO Study on AI ROI,” 2025/2026.
- 17. S&P Global / 451 Research, “Voice of the Enterprise: AI & ML, Use Cases 2025.”
- 18. Futurum Group, “1H 2026 AI ROI Survey.” 830 IT decision-makers.
- 19. Economist Impact (Databricks-commissioned), “Unlocking Enterprise AI,” November 2024. 1,100 technical executives, 19 countries.
- 20. EU AI Act (Regulation 2024/1689); Digital Omnibus on AI (COM(2025) 836), November 2025.
- 21. Texas Responsible AI Governance Act (HB 149), effective January 1, 2026.
- 22. Colorado AI Act (SB 205), delayed to June 30, 2026 per SB 25B-004.
- 23. Forbes Research, “2025 AI Survey.”
- 24. Susan Athey, MIT Sloan Management Review.
- 25. Davenport and Redman, Harvard Business Review, April 2025.
- 26. McKinsey & Company, AI EBIT impact research, 2025.
- 27. Diagnostics study on AI override rates and transparency, 2025.
- 28. CDC, National Center for Health Statistics, “Sepsis” data brief. ~270,000 sepsis-related deaths per year in the United States.
Discover more from Ajith Vallath Prabhakar
Subscribe to get the latest posts sent to your email.
You must be logged in to post a comment.